Don’t call it a comeback – nothing can hold NYC down. Driven by discounts between 2%-30%, savvy investors and Millenial to Gen Z newcomers are swooping in for opportunities to buy in the world’s greatest city.
This year we will acknowledge the 20th anniversary of the September 11, 2001 attacks. In the period surrounding the tragedy, millions counted NYC down for the count, saying it would never recover, and thus moved to the suburbs in droves. It was also during this period that Nest Seekers International was founded, growing roots downtown and now expanded to 25 offices worldwide. Many of us have been conditioned to think that challenging times mean success is impossible – when in fact, the opposite is true, and it is a time for opportunity.
We saw this same high inventory pattern and urban pessimism in the first decade of the millennium during Great Recession and sub-prime mortgage crisis.
Although more than 110,000 residents left the city from February to July of 2020, a 487% increase over 2019, not all moves were perma- nent. Many chose to temporarily relocate to vacation homes with have thus started trickling back in.
New York City home sales activity bottomed out in July and has been steadily climbing since.
We have seen similar cycles every 10 years following a local or national event, and each time the city has not only survived but has thrived.
In 2009, pricing was depressed 25%-35% from the highs of 2007. Banks like Lehman Brothers and Bear Stearns collapsed overnight. And yet, NYC grew back stronger than ever.
YEAR OVER YEAR MEDIAN LIST PRICE FOR NEW YORK CITY
In December 2020, the median list price of homes across the five boroughs was $835,000, trending up 22.8% year-over-year from 2019
We also saw a sale-to-list price ratio of 97.43% in Q4 2020, indicating that consumer expectations are being met and supply/demand is starting to level.
SALE-TO-LIST PRICE FOR MANHATTAN
B rooklyn and Queens, which offer residents more outdoor space, moderate commute time, and bigger apartments, lead the city’s recovery showing steady price and pending sales increases throughout Q4 2020 into Q1 2021. Downtown Manhattan is not far behind, though Midtown is
lagging. The first wave of new buyers were the ones who had to move and most deals were under $2 million. However, sales between $2 million and $4 million have begun picking up, exceeding the volume of contracts signed in the same months last year.

CONTRACTS SIGNED BY SUBMARKET Q4 


MANHATTAN Q4 TOTAL INVENTORY BY TYPE MANHATTAN

MANHATTAN Q4 PRICE TRENDS

QUEENS Q4 PRICE TRENDS


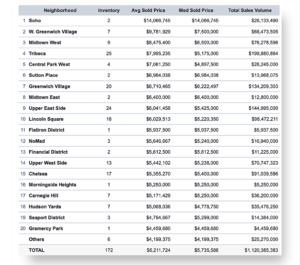
LUXURY SALES BY NEIGHBORHOODS MANHATTAN

FOURTH QUARTER OF 2020
As the revival momentum builds, developers will amend building usage to jive with the new-normal. We expect to see retrofitting of current office space for condo use, to support the continued work-from-home economy. The reinstatement of 421a and 421g tax abatements is likely. Landmark buildings like 15 Broad and 123 Washington Street emerged post-9/11 from similar efforts. The 421a tax exemption program encourages the development of underutilized or vacant property by dramatically reducing taxes for developers and end-users for a set period whereas 421g tax incentive program is a tax exemption and abatement for the conversion of commercial buildings, or portions of buildings, into multiple dwellings.
Though many expect NYC’s recovery to lag years behind the rest of the country, we at Nest Seekers know from experience that you can’t hold our great city down and are optimistic that recovery will happen faster than most foresee.